HTTP endpoint monitoring
Check any HTTP or HTTPS endpoint on a schedule: configure method, path, expected status codes and keyword match. Get alerted via email, Slack or webhook the moment a check fails. Pair with SSL certificate monitoring to cover both layers of availability.
HTTP endpoint monitoring is more specific than a simple ping or port check. A TCP connection on port 443 succeeding tells you nothing about whether your application is healthy. An HTTP monitor sends a full request — with the correct path, method and headers — and validates both the status code and optionally the response body. This catches a wide range of failures that port-level checks miss: application crashes that leave the web server running, routing errors that serve a default page instead of your API, database connection failures that cause 500s on specific routes, and deploys that introduce regressions on particular endpoints.
Configure the HTTP method to match the endpoint contract. A health route is typically a GET. A write endpoint that you want to verify is accepting requests might be a POST with an empty or test body. A HEAD request is useful when you want to check availability without triggering any server-side processing — for example, checking that a static asset CDN is serving responses without downloading large files on every check cycle.
Expected status codes are configured as a list, not just 200. A redirect endpoint should expect 301 or 302. An authenticated API route returns 401 when checked without credentials — which is correct behaviour and should not trigger a downtime alert. A catch-all 404 on an unknown path is sometimes the right expected response when you are monitoring that a service is reachable but do not have a dedicated health route. Matching against a list of acceptable codes rather than a single value prevents false positives that would otherwise produce alert fatigue.
Keyword matching in the response body verifies application-layer health beyond the status code.
A web server that returns 200 with a generic error page — for example, when a reverse proxy loses its upstream
connection — passes a status-code-only check. A keyword match on {"ok":true} or any application-specific
token in the response catches this class of failure. The match is a substring check against the raw response body,
applied only when the status code check passes.
Response latency is recorded on every check and available in the history view. You can identify degradation trends before they become failures: a health route that normally responds in 80ms but is now taking 1.2 seconds may indicate a database index problem, a memory leak, or a downstream dependency bottleneck. Latency history per monitor over the last 100 checks gives you the data to correlate performance changes with deployments or infrastructure events.
Set the check interval based on the cost of undetected failure for that specific endpoint. A public-facing checkout API warrants 1-minute checks (paid plans). An internal admin dashboard that only needs to be available during business hours can run on a 60-minute interval (free tier). Paid plans support 1-minute intervals across all monitors; free plans run at a longer cadence. The interval is configurable per monitor, so you can mix frequencies across your fleet.
Monitors integrate with your incident management workflow through alert channels. Email is the baseline. Slack channels route alerts to the right team without spamming general channels. HMAC-signed webhooks deliver a structured payload — monitor name, target URL, status code received, latency, error detail, timestamp — to any receiver: PagerDuty, Opsgenie, a custom Lambda, or a Slack incoming webhook with custom formatting. SMS is available on paid plans for highest-urgency monitors.
Combine HTTP endpoint monitoring with SSL certificate monitoring on the same hostnames. A TLS certificate expiring causes the HTTP monitor to fail with a connection error — but you could have had 30 days of warning from the SSL monitor before the outage happened. Running both types of monitor on a domain creates a complete availability picture: pre-failure certificate warnings and real-time HTTP failure detection in the same dashboard.
The free tier includes 10 HTTP monitors and 10 SSL certificate monitors with email and Slack alerting. Starter at $15/mo adds 25 of each, 1-minute intervals, signed webhooks, and REST API access. The REST API lets you pull monitor status and history into your own dashboards or trigger checks programmatically.
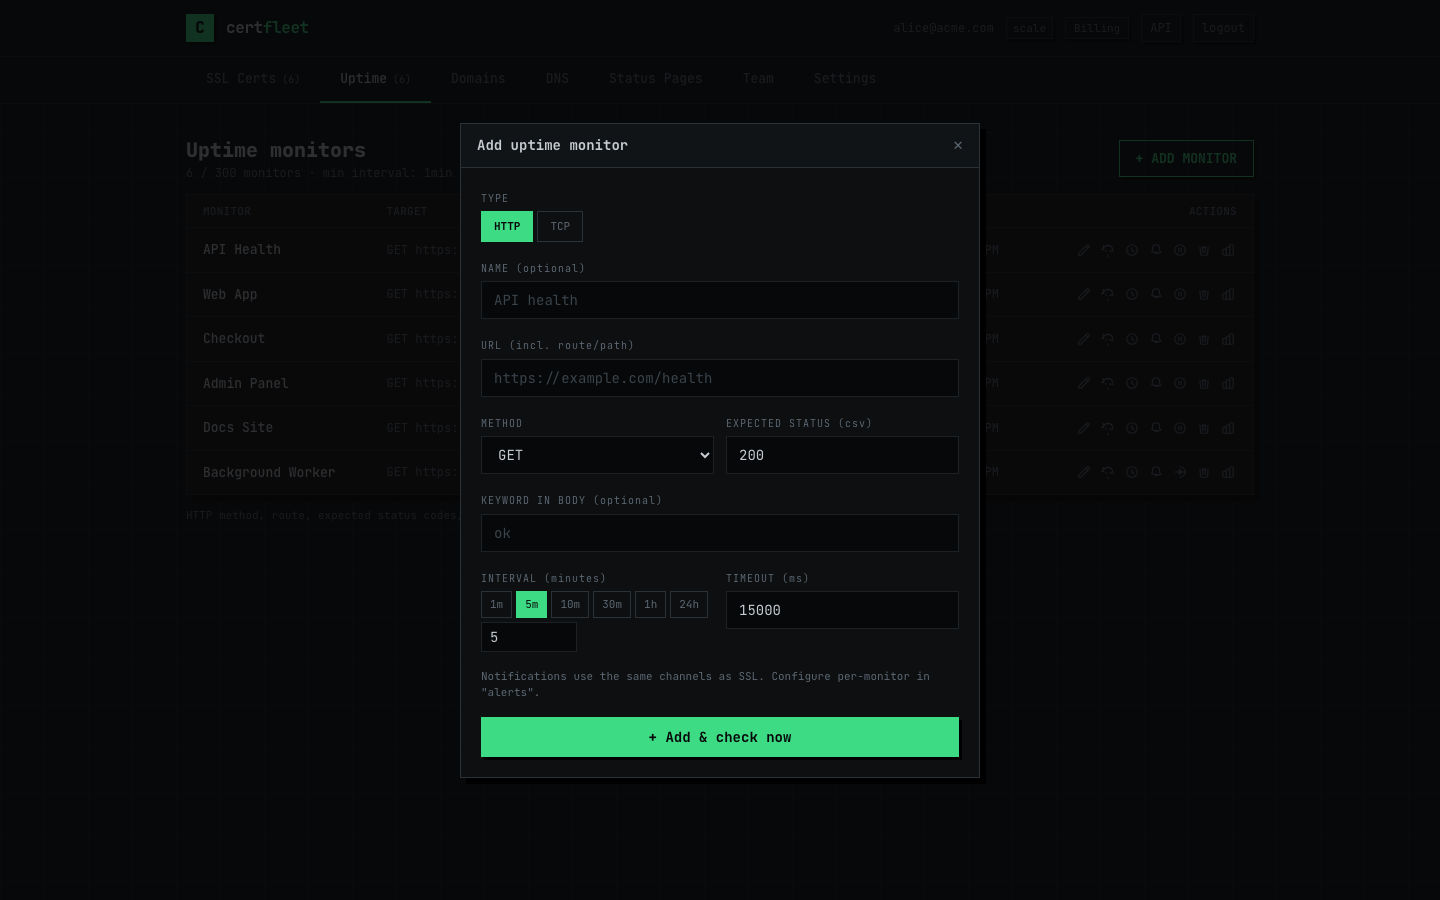
Configure an HTTP endpoint monitor in under a minute — method, path, expected status codes, keyword match in body, and check interval. No agent to install.
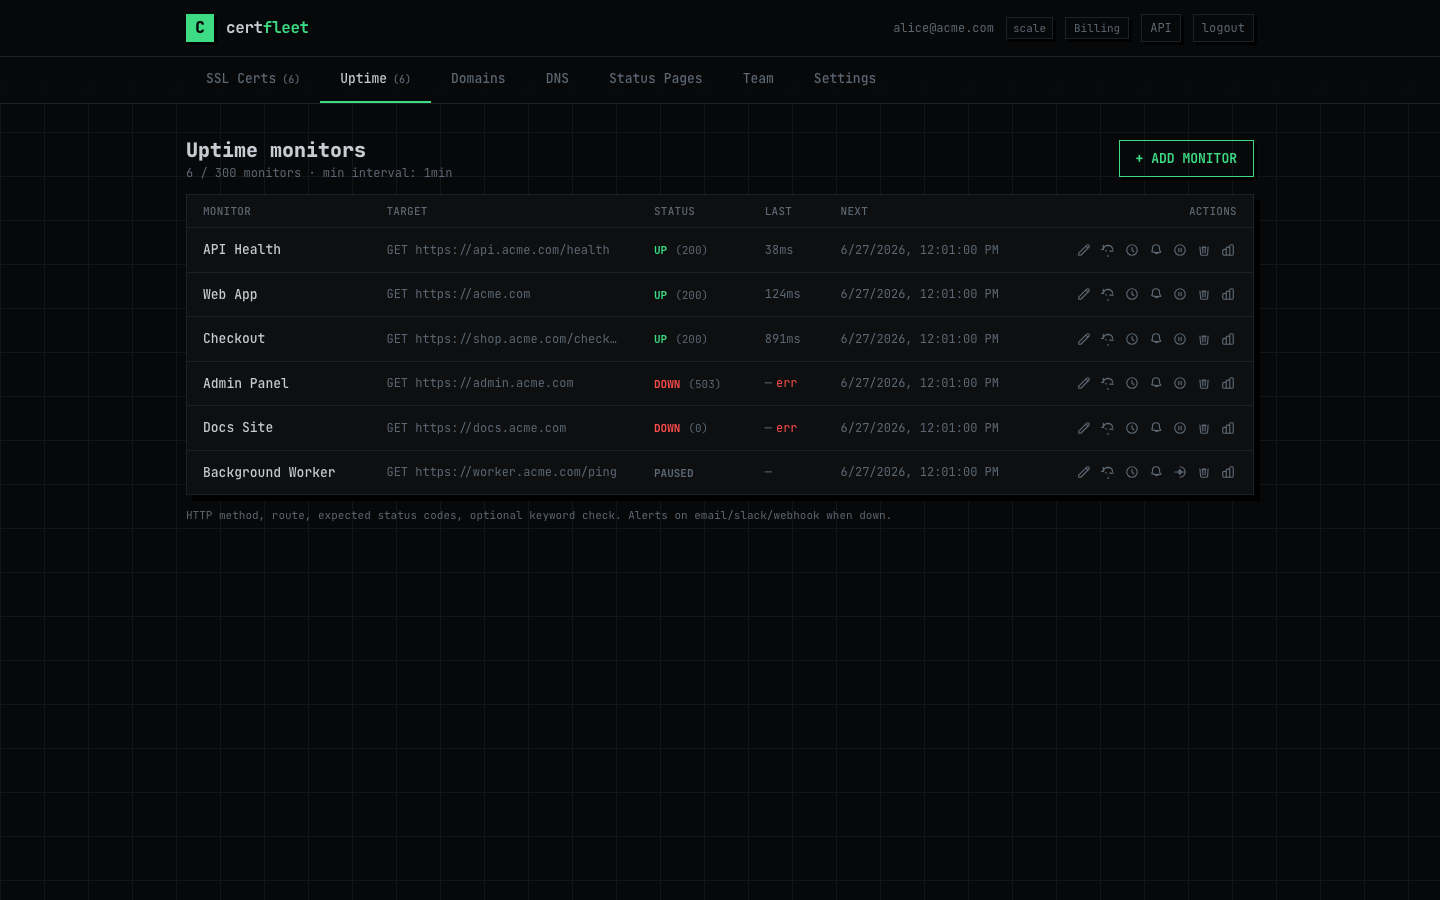
All monitored endpoints at a glance — status, response time, uptime percentage. Alert fires on the first failure transition and auto-resolves on recovery.
| Check type | What it verifies | Failure caught |
|---|---|---|
| Status code | HTTP response is in expected list | Application crash, routing error, 500 |
| Keyword match | Response body contains expected string | Reverse proxy fallback page, partial outage |
| Latency | Response time recorded per check | Degradation, DB slowdown, memory pressure |
| Reachability | TCP + TLS connection succeeds | DNS failure, network outage, expired SSL |
Configure any HTTP endpoint in under a minute. Free for 10 monitors and 10 SSL certificates, no credit card.