Website uptime monitoring
CertFleet monitors your websites and API endpoints with configurable HTTP checks — and combines uptime monitoring with SSL certificate monitoring in a single focused tool. Get alerted the moment something goes down, before your users report it.
How uptime monitoring works
Uptime monitoring sends HTTP or HTTPS requests to your endpoints on a fixed schedule and validates the response. The check succeeds when the server returns one of your expected status codes within the response time limit. It fails — and triggers an alert — when the server is unreachable, returns an unexpected status code, or the response body does not contain a required keyword.
Configure each monitor with the precision your endpoint requires. Choose the HTTP method (GET, POST,
HEAD), the full URL path including query parameters, a list of expected status codes
(200, 201, 301, 401 — whatever is correct for that endpoint), and an optional keyword match in the
response body. A health check returning {"status":"ok"} is verifiable at the application layer, not just
at the load balancer. This catches the case where the web server responds 200 but the application behind it is broken.
Check intervals: how fast you detect an outage
Check intervals range from 1 minute (paid plans) to 60 minutes (free tier). For public-facing services, a 1-to-5-minute interval limits the detection lag to under 5 minutes from first failure to alert. For internal services where failures are less frequent but more impactful, 1-minute checks catch regressions immediately after a deployment. Paid plans support 1-minute intervals across all monitors; the free tier runs at a slower cadence suited to low-risk environments.
Status-transition alerting, without alert fatigue
Alerts fire on status transitions, not on every failed check. When a monitor transitions from up to down, one alert fires. When it recovers, a recovery notification follows. This keeps notification volume low and ensures every real outage generates exactly one page — avoiding the alert fatigue that causes on-call engineers to start ignoring their monitoring system. You can pause a monitor during planned maintenance to suppress alerts without deleting the configuration.
Alert channels: email, Slack, signed webhooks, SMS
Alert channels match your team's workflow. Email is the default. A dedicated Slack channel routes downtime alerts to the infrastructure team without noise in general channels. Webhooks (HMAC-signed for security) integrate with PagerDuty, Opsgenie, or any custom receiver — the payload includes the monitor name, URL, status code received, latency, and timestamp, giving your incident management system everything it needs to create and route an incident ticket automatically. SMS is available on paid plans for highest-urgency scenarios.
Check history, uptime % and SLA reporting
Every check is stored with a timestamp, response time, status code, and error detail. The history view in the dashboard shows a full timeline for each monitor, an uptime percentage calculated over the last N checks, and per-check latency. This data is useful for post-mortems ('when exactly did the service go down?'), for SLA reporting, and for identifying degradation trends before they become outages.
Uptime monitoring + SSL certificate monitoring together
Pair uptime monitoring with SSL certificate monitoring on the same domains. An expired SSL certificate causes a TLS handshake failure — the uptime monitor fires 'down' with no HTTP response. But you could have known 30 days earlier, when the SSL monitor first crossed its expiry threshold. Having both monitors on a domain means you get pre-failure SSL warnings and real-time uptime detection together — eliminating the two most common causes of unplanned downtime.
The free tier includes 10 uptime monitors and 10 SSL certificate monitors. The Starter plan at $15/mo scales to 25 of each, with 1-minute check intervals, webhooks, and REST API access. Uptime monitors integrate with the same alert channel configuration as SSL monitors — configure email, Slack, and webhooks once, apply them across your whole fleet.
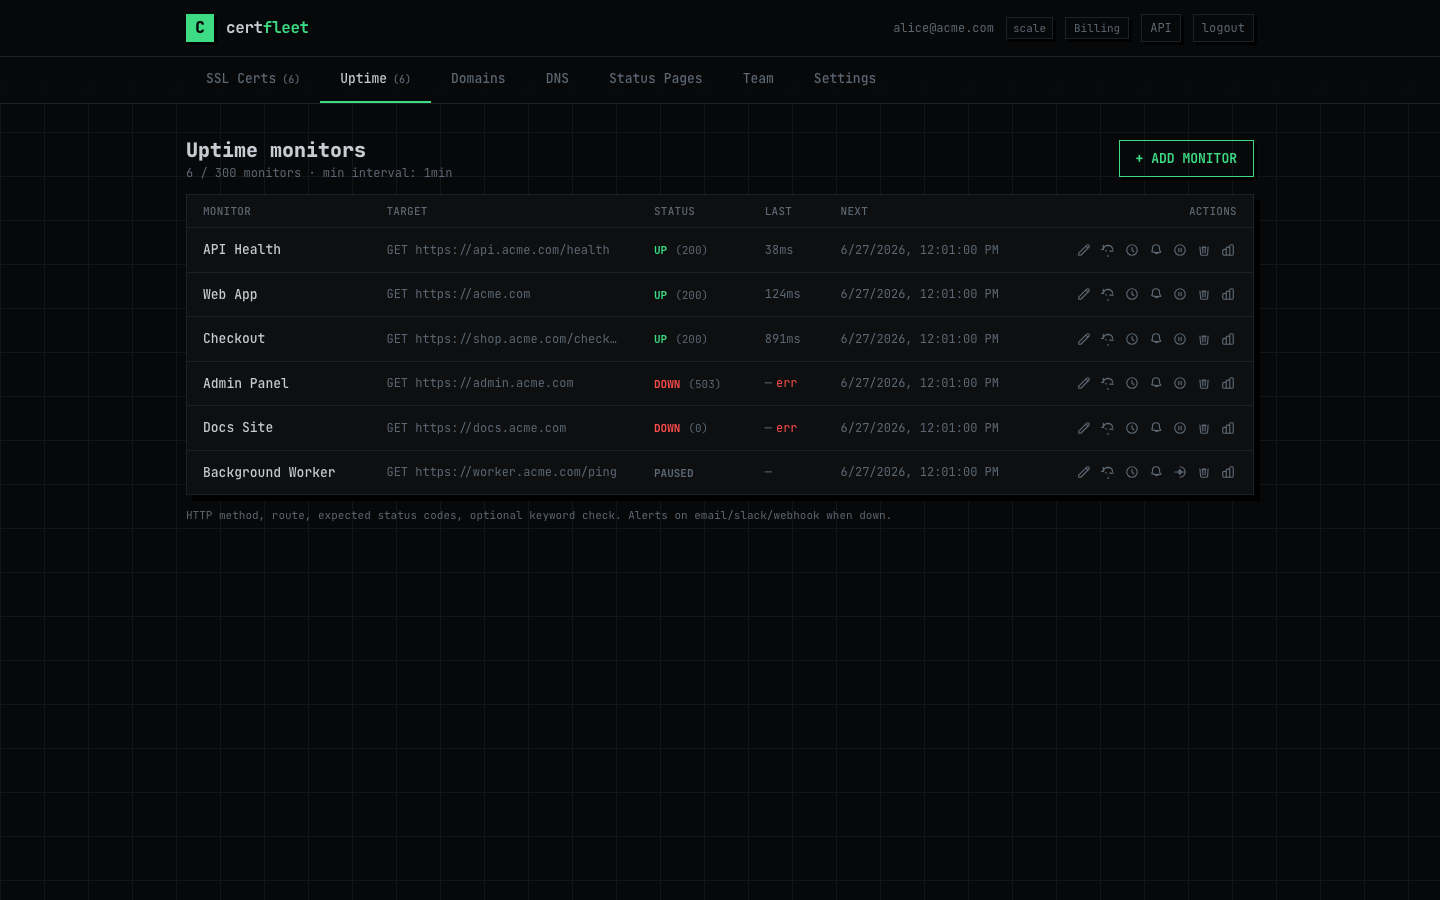
Uptime monitors dashboard — each endpoint with its current status, response latency, uptime percentage and last-check timestamp. One alert per failure transition, one recovery notification when it comes back.
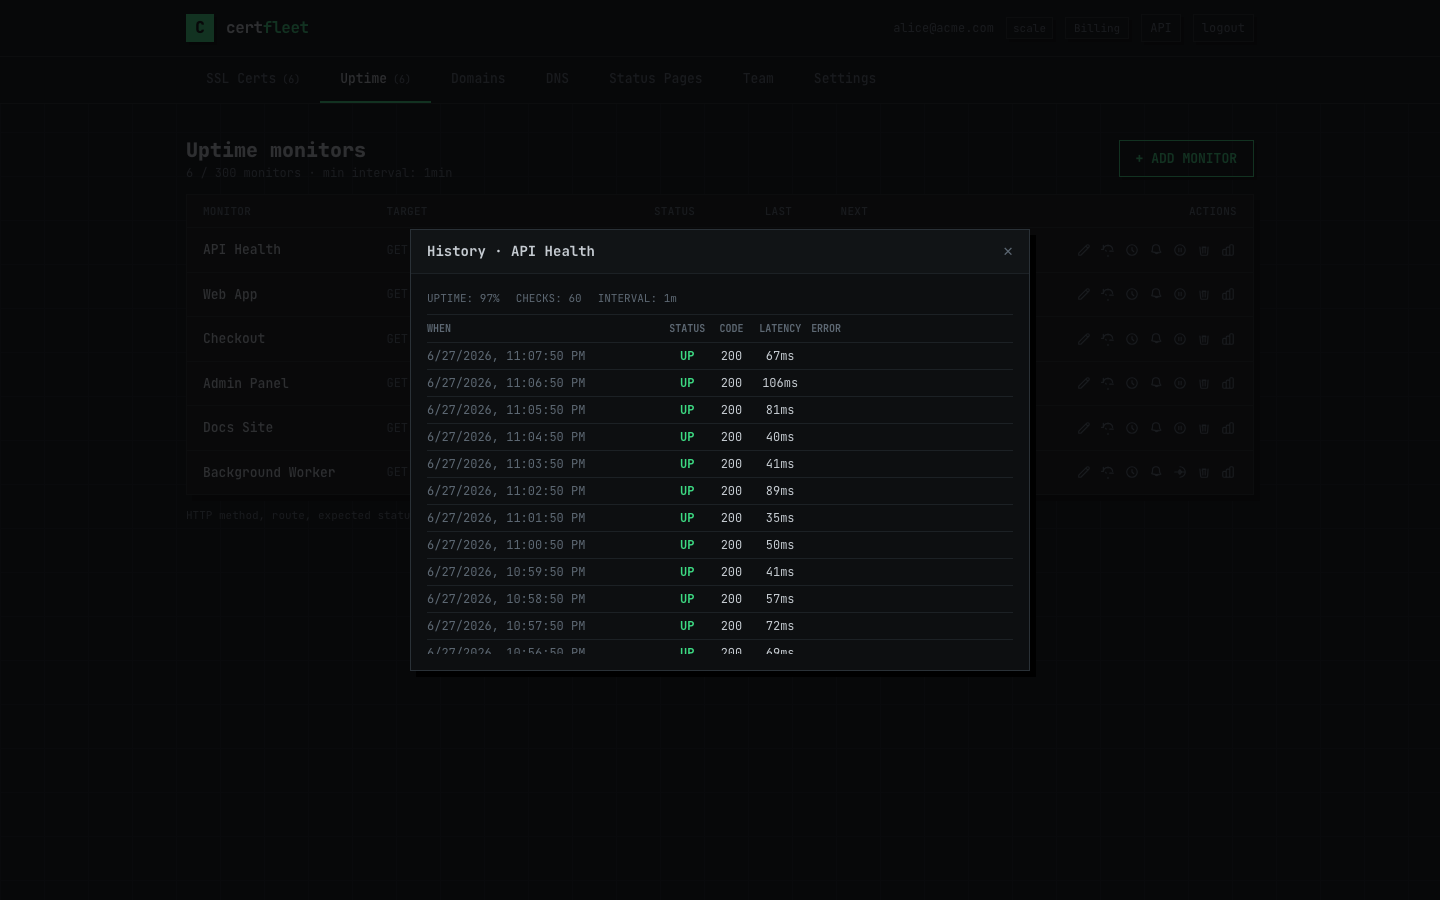
Per-monitor history — latency trend and status timeline for post-mortems, SLA reporting, and identifying degradation before it becomes a full outage.
Any method, full path, expected status codes, keyword match in body.
Email, Slack, signed webhook, SMS. One alert per transition, not per check.
Timestamp, status code, latency, error detail. Uptime % over rolling window.
Frequently Asked Questions
What is uptime monitoring?
Uptime monitoring sends HTTP/HTTPS requests to your website or API on a fixed schedule and validates the response. A check passes when the server returns an expected status code within the response-time limit, and fails — triggering an alert — when the endpoint is unreachable, returns an unexpected code, or is missing a required keyword in the body. It tells you a service is down before your users do.
How often does CertFleet check my endpoints?
Check intervals range from 1 minute on paid plans to 60 minutes on the free tier. A 1-to-5-minute interval keeps detection lag under 5 minutes from first failure to alert, which is the right cadence for public-facing services. The free tier runs a slower cadence suited to low-risk internal endpoints.
Will I get an alert for every failed check?
No. Alerts fire on status transitions, not on every failed check. One alert fires when a monitor goes from up to down, and one recovery notification fires when it comes back. This keeps notification volume low and avoids the alert fatigue that makes on-call engineers ignore their monitoring. You can also pause a monitor during planned maintenance.
Can I monitor API endpoints, not just websites?
Yes. Each monitor lets you set the HTTP method (GET, POST, HEAD), the full URL path with query parameters, a list of expected status codes, and an optional keyword match in the response body. A health endpoint returning {"status":"ok"} is verified at the application layer — catching the case where the web server answers 200 but the app behind it is broken.
Does uptime monitoring include SSL certificate monitoring?
Yes. CertFleet combines HTTP uptime monitoring with SSL certificate monitoring in one tool. An expired certificate causes a TLS handshake failure and shows up as downtime — but the SSL monitor would have warned you 30 days earlier when the certificate first crossed its expiry threshold. Running both on the same domain covers the two most common causes of unplanned downtime.
How is this different from UptimeRobot or Pingdom?
CertFleet matches the core uptime feature set (method, path, status codes, keyword match, history, uptime %) but adds real SSL certificate depth: a live TLS probe that reads the certificate your server actually serves, plus Certificate Transparency log alerts for newly issued certificates. It also ships a no-login SSL checker and HMAC-signed webhooks at the entry tier.
Add your first uptime monitor and SSL certificate monitor in under a minute. Free for 10 of each, no credit card.
Built in France • Architecture & RGPD • See all plans